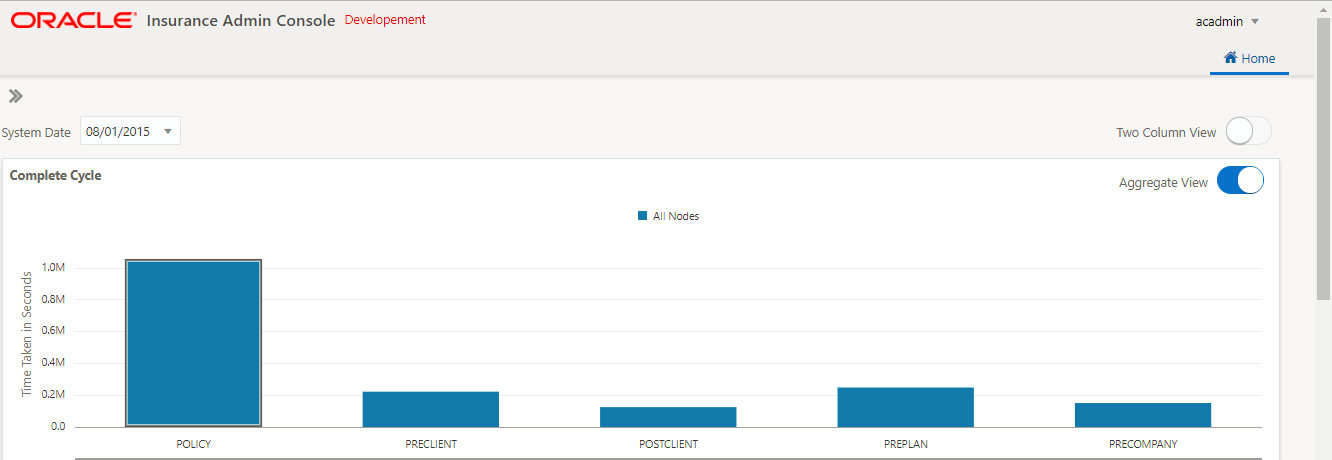
Chart1 - Cycle Steps and Cycle Client Members
Processing Time (Y-axis) Vs Cycle Processing Step (X-axis)
This chart is displayed in two views, Aggregate and Non-Aggregate views. The user can select the Toggle to switch between these two views. The toggle is named as "Aggregate View" with "ON" and "OFF" values. It is "ON" by default (i.e. Aggregate view).
Toggle allows the user to select when the chart displays an Aggregation of execution time by executed cycle step or as a separate detail by individual executions of the cycle steps and the server nodes used during the execution.
The user can select Cycle's System Date from the drop down to view the cycle from any persisted date. By default, the latest System Date is selected.
Aggregate View
By default, the cycle chart is displayed as an aggregation of processing time for each executed cycle step. The cycle steps are an aggregate of execution time regardless of multiple executions of the steps and the number of server nodes employed in the step’s execution. In this view, Y-axis represents processing time while the X-axis represents the cycle steps with the following step names:
- Pre-Company
- Post-Company
- Pre-Plan
- Post-Plan
- Pre-Client
- Post-Client
- Policy
A click of a cycle step will populate the next chart (i.e. Chart 2) with the cycle step's information [for the selected cycle step name]. By default, the left most cycle step is selected for population of the next chart.
Non-Aggregate View
When toggled from the default setting, the chart will display the cycle steps as individual cycle step executions (multiple executions of a cycle step) in the order of execution and the server nodes used by the cycle step execution.
Note: The order displayed is the execution order established by the ProcessGMT. Multiple executions of a cycle step may be presented multiple times along the X-axis. The step name will be suffixed with a counter. For example, Policy-01, Policy-02 etc.
A click of a cycle step will populate the next chart (i.e. Chart 2) with the cycle step's information [for the selected cycle step name]. By default, the left most cycle step is selected for population of the next chart.

